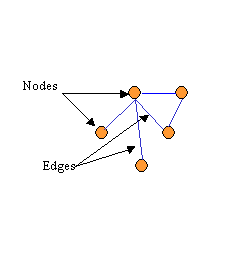
A central feature of VitaPad's design is that the formal structure of pathway graphs is completely independent from the scientific information they represent. The basic graph structure that VitaPad uses is largely similar to the one typically used to represent any kind of network graph. A graph consists of a series of nodes (or vertices) which are connected by edges (see Figure 1a) For our purposes, nodes represent biological entities and edges the reactions or relations between these entities. For example, in a metabolic pathway, chemical compounds would be nodes and edges can be used to show biochemcial reactions. In a signalling pathway, the nodes could be individual genes and edges could represent gene regulations.
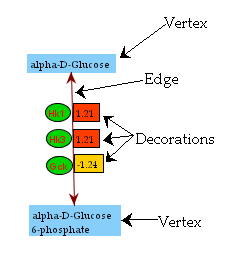
To this typical structure we add a third class of object, the decoration which modifies or acts upon an edge. This is used to display information that is a property of the edge (see Figure 1b). For example, in a metabolic pathway the genes or enzymes that catalyze a particular biochemical reaction could be decorations. So could an expression value or other piece of data that quantifies a reaction or regulation

|

|
| Figure 1a | Figure 1b |
Independence of domain-specific and graphical information is also enforced at the rendering level. The rendering process is concerned with the representation of a series of abstract on or two-dimensional shapes. Biological concepts like genes, reactions or compounds are not "hard-coded" into the rendering process. In this way, we can render a new class of pathway data simply by entering a few details about how it is to be rendered (things like color, shape, font, etc.) in the database.
This also allows for a great deal of customization as to how objects are rendered. VitaPad allows for three levels of customization: